Michael Turmon, JPL, February 2015
This brief note explains the format of M-TARP quicklook movies,
which are derived from the mdi.tarp data series.
The movies can give you a quick overview of an M-TARP's extent.
Each movie covers one year (5400 frames, less missing data).
The wiki entry has more on the data series itself.
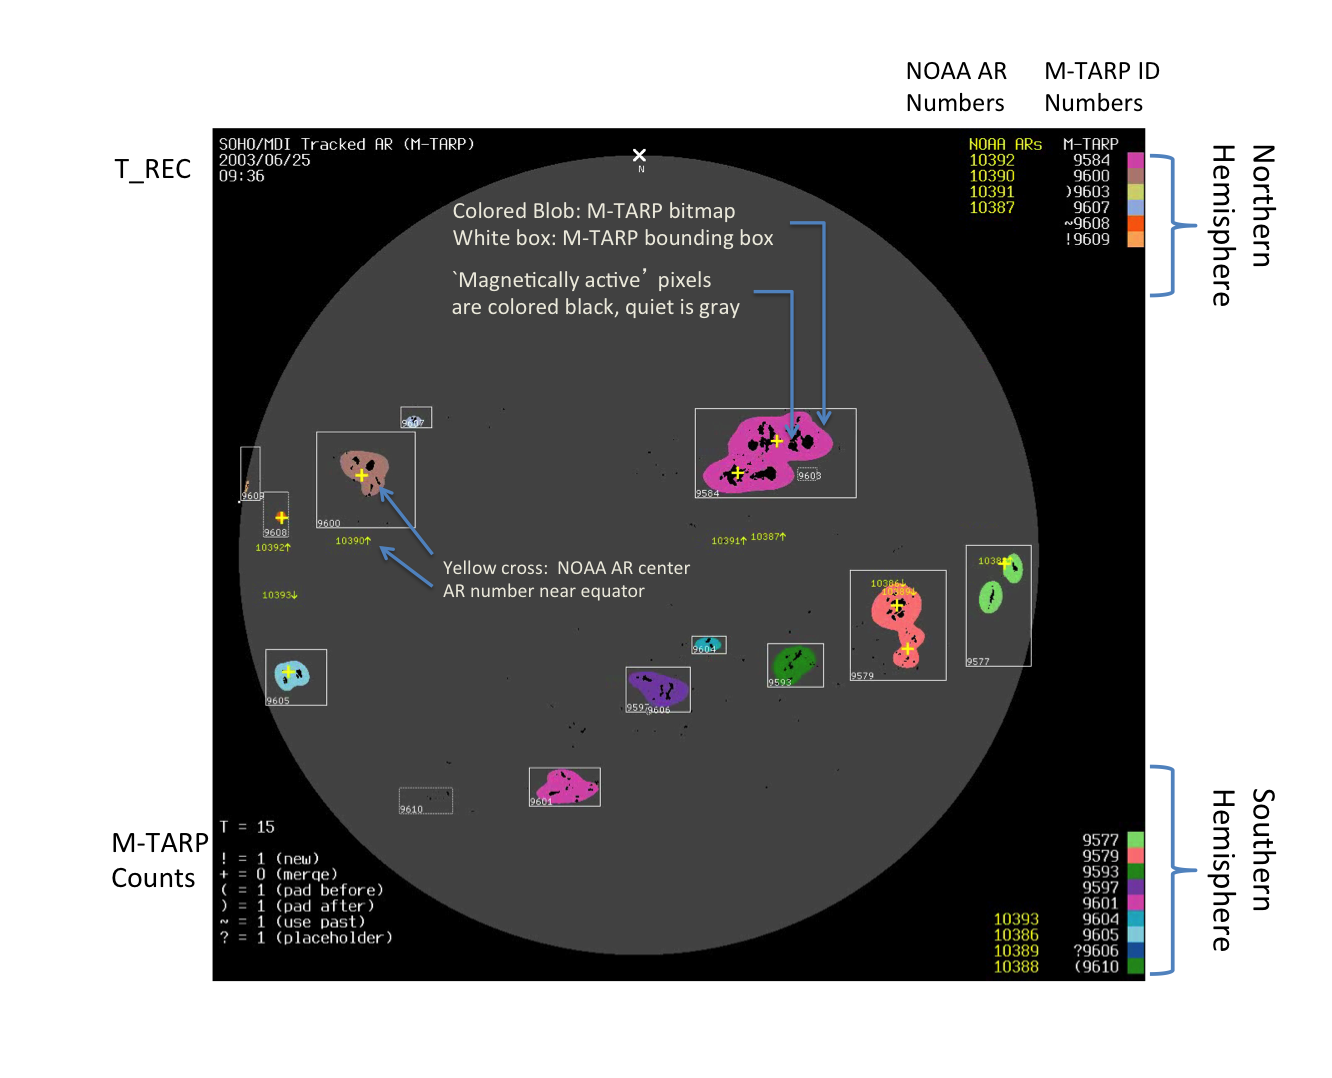
Here is a still image from an MDI TARP movie (click to enlarge).
The movies have 1024x1120 pixel frames, large enough to show the MDI full-disk images at full size. The disk is gray, and pixels labeled as "active" within the gray disk are black.
The colored blobs, which we call patches when we're referring to just a single image, represent the content of each M-TARP in that image. (Clumps of black pixels outside the TARPs are magnetically active, but not concentrated enough to combine into a TARP.) The color of the patch is related to its TARP ID; the key at right helps to map colors to numerical ID. By numerical coincidence, two TARPs can share the same color, as with 9684 and 9601 here (pink).
The white bounding box surrounding the patch encircles all within-TARP pixels, so you can tell TARPs apart even if they happen to have the same color. The TARP ID is in the corner of the bounding box, and the list of all TARP IDs is in the legend on the right side.
Note, the TARP is defined to be the content of the colored patches within the bounding box, not the bounding box itself.
NOAA ARs are shown in yellow: listed, in order from left to right, in the text overlay, and shown in the proper location on the disk as a yellow cross, with accompanying number moved along the equator to avoid overplotting. (The offset from the equator is proportional to latitude, for the same reason.)
The upper left corner has T_REC, in TAI units,
the lower left corner has TARP counts within the image,
and the right corners hold active region lists,
separated into northern and southern hemispheres.
The movie directly reflects various keywords
(here written LIKETHIS)
within mdi.tarp.
Of course, T_REC and HARPNUM (the AR number)
are on the movie.
The colored patch corresponds directly to the
bitmap data segment of the M-TARP (i.e.,
the colored region consists of those pixels
within the bitmap segment of value 32 or greater).
The corner of the
white bounding box is at location
CRPIX1, CRPIX2 in the original imagery (e.g., mdi.fd_M_96m_lev182),
and the white bounding box is CRSIZE1 by CRSIZE2 pixels.
Finally, the latitude/longitude bounding box of the TARP
(LATDTMIN, LATDTMAX, LONDTMIN, LONDTMAX) is
enclosed by the
white pixel bounding box here.
The time of the "region created"
event corresponds to T_FRST1, and the last solid-border
M-TARP outline (the last observation of the TARP) corresponds
to T_LAST1.
The first and last instances of padding (dotted boxes, see below)
correspond to T_FRST and T_LAST.
Placeholder and "use past" regions are signalled by
partly dotted outlines, and H_FAINT = 1; placeholders additionally
have a missing value for NPIX, the on-region pixel count.
Similarly, times where merges were done are shown by
the + character in the movies, and H_MERGE = 1 in keywords.
Below is the same image, with further annotations.
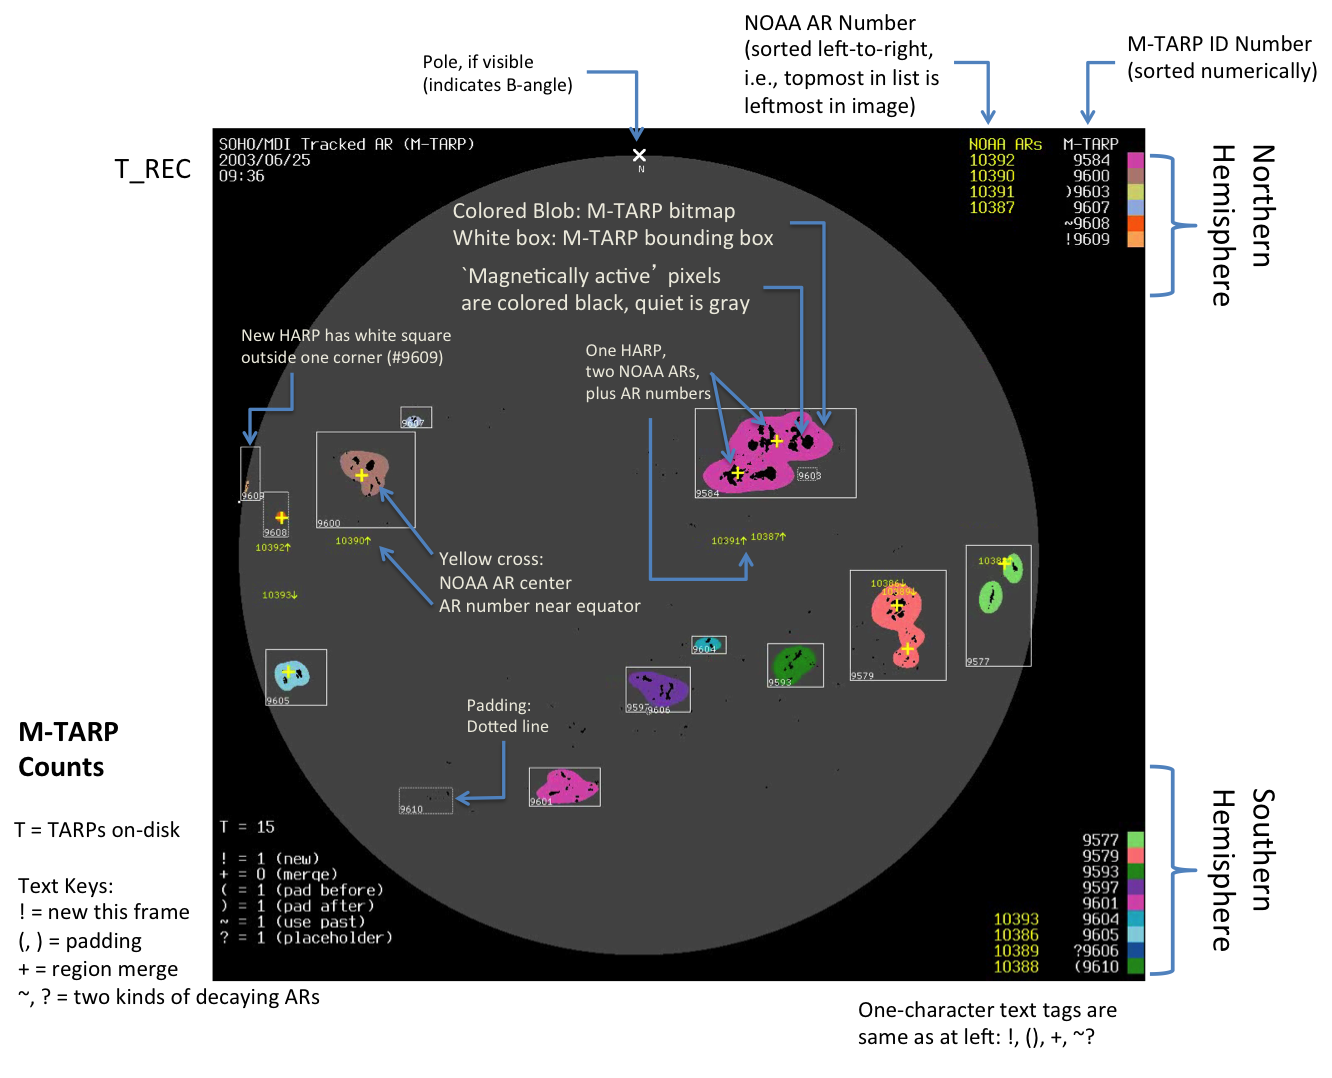
Regions that are new in this frame are shown with a white square hanging
outside the corner of the white bounding box (M-TARP 9609 is new
in this frame, on the east limb), and a ! character in the right-hand legend.
The time of this event corresponds to T_FRST1 in the keywords.
A one-day padding period extends before and after the time interval where
the M-TARP is observed.
Padding is shown with a dotted white bounding box, and by a ( or )
character in the legend.
The dotted white bounding box can occur for other reasons. An M-TARP that is lost and later re-appears has a gap (usually just a handful of frames) which is filled by "placeholder" frames. These frames are part of the M-TARP, but have empty bitmap segments. M-TARP 9606 in this frame is a placeholder (barely visible, near the purple region). This is indicated by ? in the legend.
M-TARP 9608 illustrates an intermediate case, in which the HARP can only be detected because we expect to see it based on prior images. This is indicated by partly-dotted lines, and a ~ character in the legend. In this case, the bitmap will not be empty, because on-HARP pixels were found.
Sometimes, as in the westmost green patch here (M-TARP 9577), the white bounding box encloses several unconnected areas separated by quiet Sun. This can happen for decaying regions that have become separated, or for growing regions that will eventually become connected in a region "merge." A small white square will appear inside the upper-right corner of the white bounding box on the frame where the merge happened (this is usually not of interest).
All four corners of the movie have text insets.
Top left: Shows time and date of T_REC for this image.
Bottom left: Total number of HARPs in this frame, plus counts of special TARPs: new TARPs (rare), before/after padding regions, merging TARPs, faint TARPs (detected using past outlines), and placeholder TARPs (undetected in this frame).
Top right: For the northern hemisphere, shows the M-TARP ID of the current region sets, sorted from lowest to highest ID, with the special-designation character if applicable (e.g., ! for new M-TARPs).
The NOAA AR numbers are listed, in left-to-right order (not numerical). (Note, the ordering is not by longitude, but by column in the image, so your eye can easily tell the ordering.) Each number corresponds to a yellow cross and a tiny text label on the image overlay.
The positions of NOAA ARs are shown as yellow crosses on the disk. These positions are only supplied once per day (nominally at 24:00 UT), so for other times, positions are linearly interpolated in latitude/longitude coordinates. Occasionally, the positions change too fast to be consistent with solar rotation, or exhibit other motions; this is present in the original data. Where correction is obvious, the local copy of the NOAA database is sometimes corrected.
NOAA ARs can appear to hover near the limb because only the visible content is taken in to account when computing the center. Also, there is a pause in motion of six hours that occurs before the start and after the end of the lifetime of each NOAA region, due to the lack of any data beyond the endpoints to use in interpolation. That is, if the region first appeared in the NOAA catalog at 24:00 UT on February 14, it would appear as a stationary yellow cross between 18:00 UT and 24:00 UT, after which it would drift westward as expected. This can help a little in spotting new NOAA ARs.