Michael Turmon, JPL, February 2015
This brief note explains the format of
information in the M-TARP synoptic map browser,
which comes from the mdi.Mtarp data series.
Each browser view corresponds to one Carrington rotation (CR).
The map interface allows you to choose a CR by filling in its four-digit number directly, or by giving a date (YYYY.MM.DD, or just YYYY.MM, which assumes day 15).
Or, you can go backward or forward by one CR.
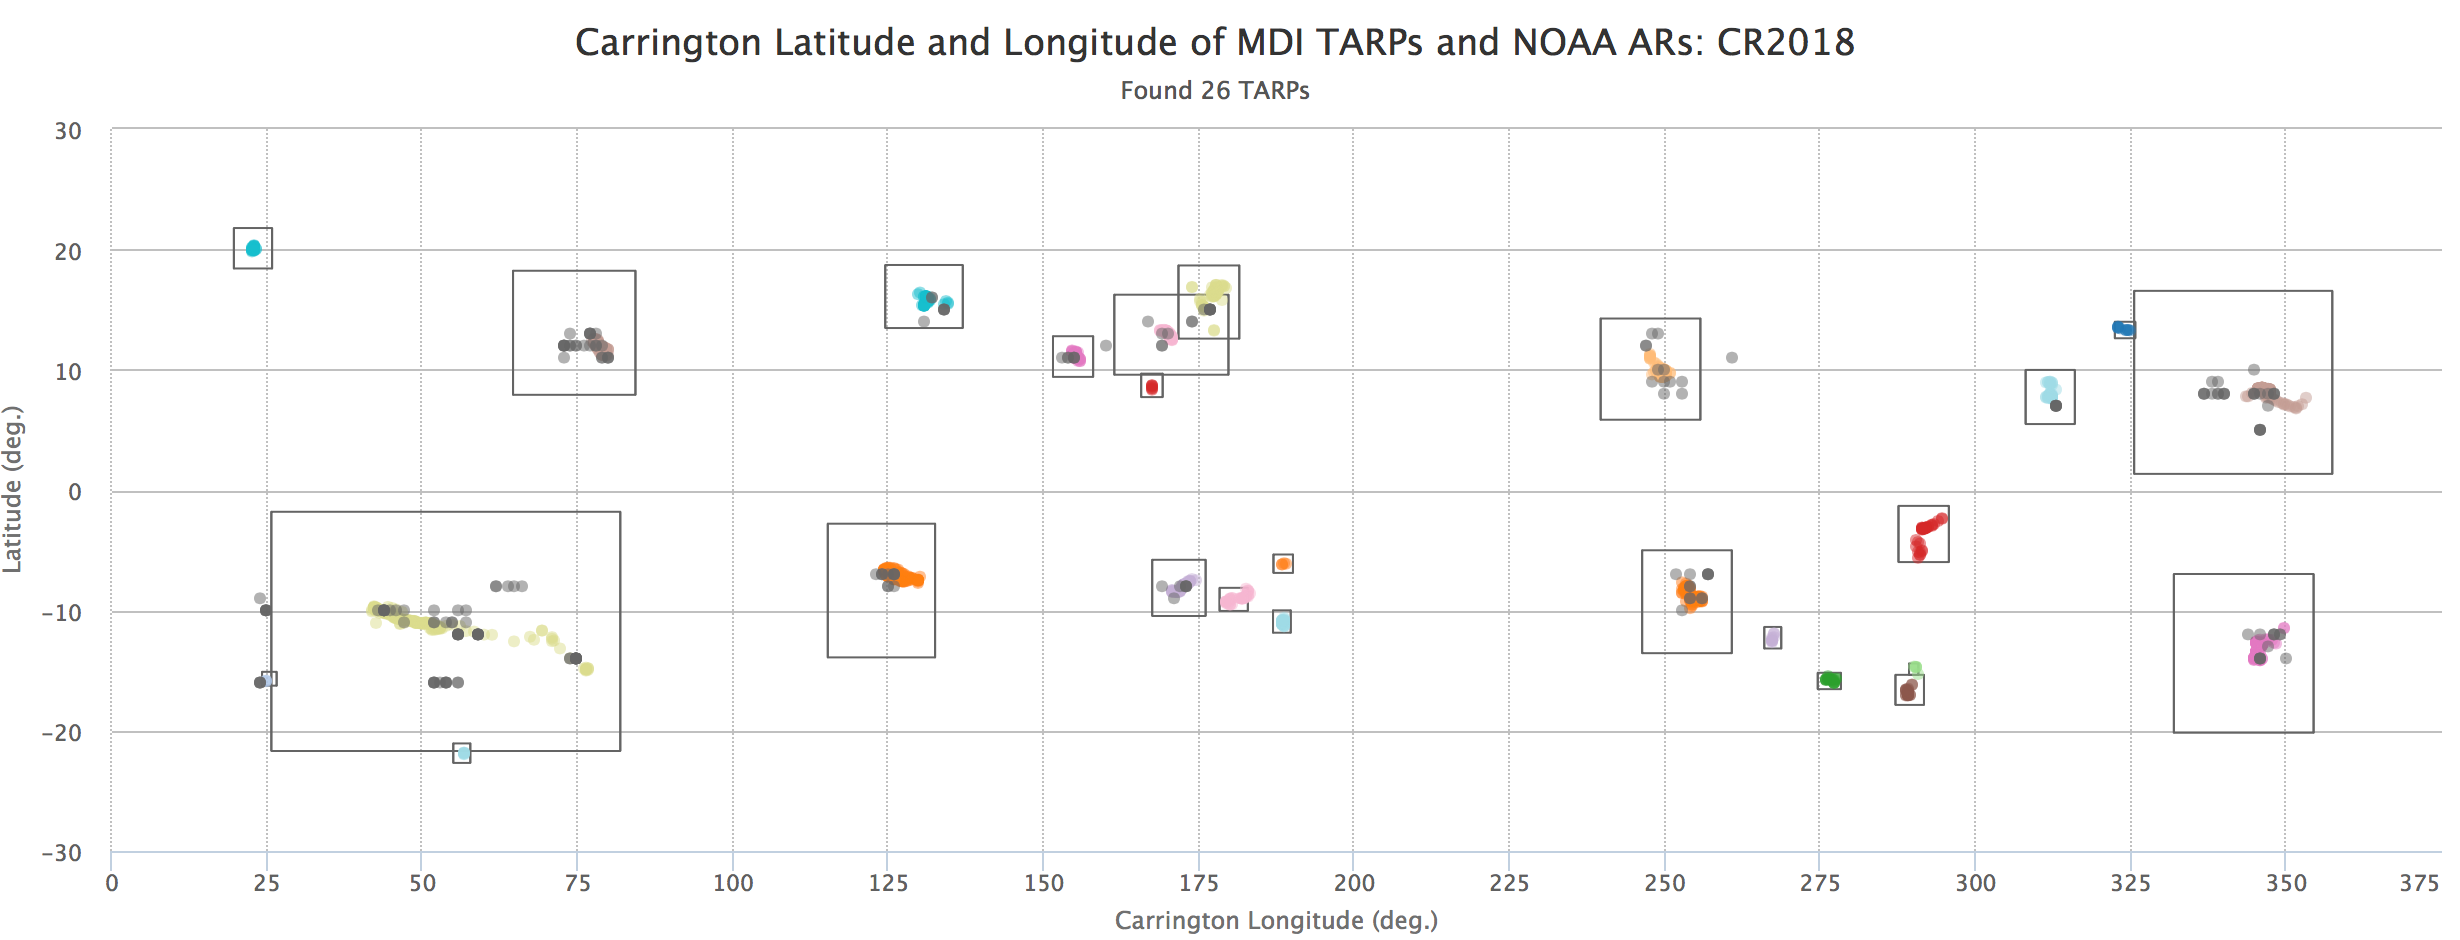
The map itself is as follows (click to enlarge):
The map is in Carrington coordinates. You can zoom in by selecting a rectangle of interest. Each colored dot indicates the flux-weighted centroid of one observation of one M-TARP. The dot color of each AR matches the color in the yearly tracker movies, and in the region table below the map.
The point cloud for each M-TARP is surrounded by a gray box that indicates its latitude-longitude extent.
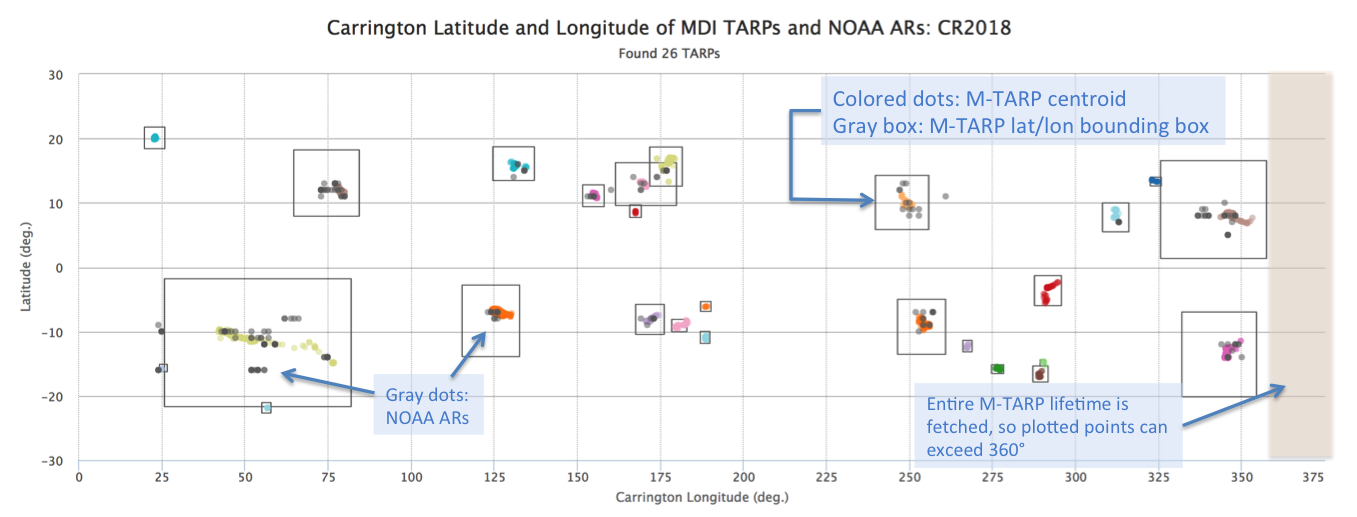
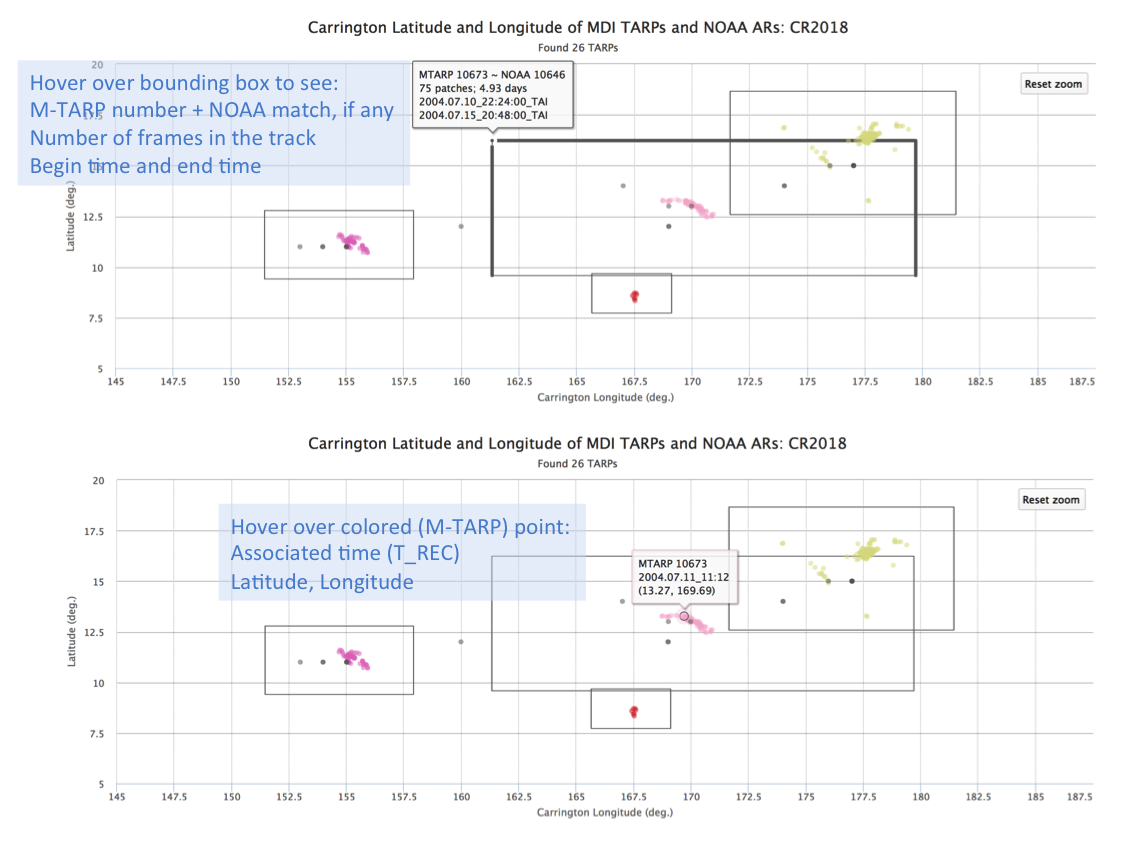
More information shows when you hover over points or boxes, as in the zoomed maps below.
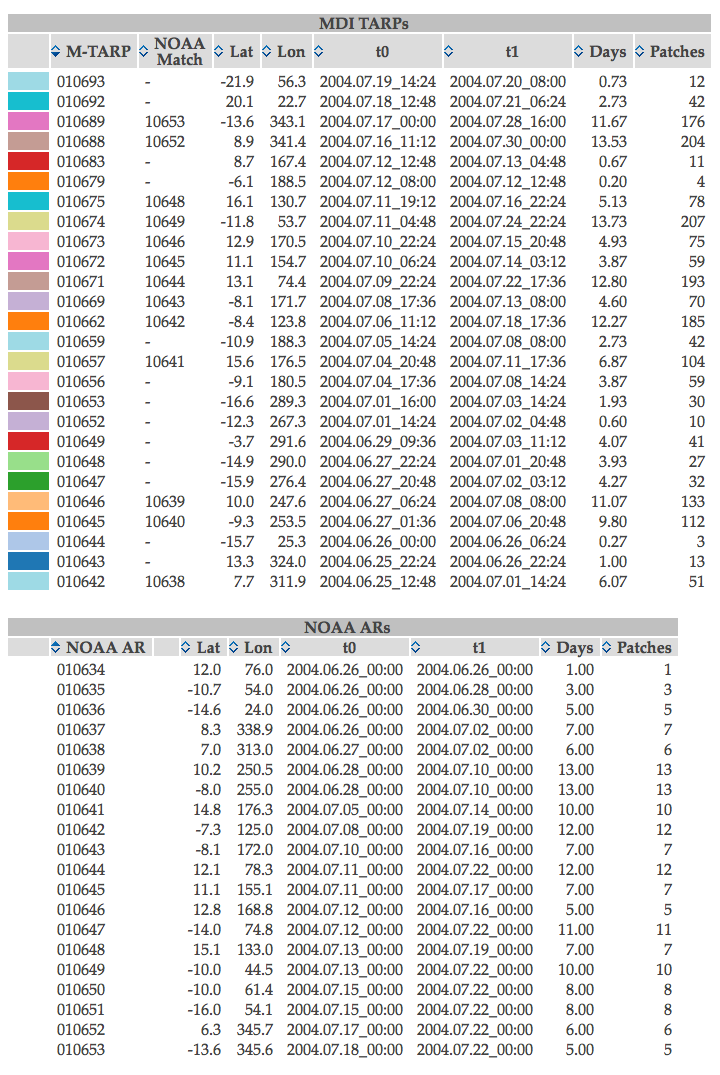
We produce a table of M-TARPs and NOAA ARs present in the displayed map. The table is generated from the same data as used for the map, and shows much of the same information: the region number, the latitude and longitude of an example point, the begin and end times, the length of the track in days, and the number of images the region was present in.
Both tables are sortable on all relevant header attributes. Sorting by longitude, latitude, or size can be helpful to identify interesting regions. The column used for sorting, and the sort direction, are indicated in the small icon on the left side of the column header.
The synoptic map directly reflects various keywords
(here written LIKETHIS)
within mdi.Mtarp.
Of course, T_REC and HARPNUM (the AR number)
are displayed in various places.
The temporal extent of the M-TARP shown
corresponds to T_FRST1 and T_LAST1.
The latitude/longitude bounding box of the TARP
(LATDTMIN, LATDTMAX, LONDTMIN, LONDTMAX) is
enclosed by the
black bounding box here.
The colored points are the flux-weighted latitude
and longitude (FWT_LAT, FWT_LON) at
a particular time.
The positions of NOAA ARs are shown as gray dots on the map. These positions are supplied once per day (nominally at 24:00 UT). Occasionally, the positions shown have wild jumps: this is present in the original data. Where correction is obvious, the local copy of the NOAA database is sometimes corrected.