This page links to summaries of a tracked
active region data product (M-TARP),
now available as mdi.Mtarp in DRMS.
The 96-minute M-TARP data product is indexed by active region
number, and within that, by time.
For more information on the data product, see
the summary in the wiki.
The series is computed using the same rules as the
companion HMI data product, hmi.Mharp_720s,
also described in the wiki.
The movies and synoptic maps below are
designed to help find specific
times or regions within mdi.Mtarp that you are seeking.
To identify regions of significant activity,
the M-TARP product uses magnetic activity masks; it
also includes information from a sunspot mask.
The MDI magnetic activity mask, mdi.fd_Marmask, is a
two-value mask simply indicating "significant magnetic activity".
It is intended to be the MDI version of the HMI
series
hmi.Marmask_720s,
which is used to produce the HMI tracked region series.
This activity index is almost completely based on magnetic information.
The sunspot mask, mdi.fd_spotmask, is a three-value
mask indicating quiet Sun, facula, or sunspot. This, of course,
uses full-disk intensity.
There is currently no HMI analog of this series.
Both types of mask depend on the 96-minute cadence line-of-sight
magnetograms (mdi.fd_M_96m_lev182), and the 6-hour cadence
(flattened) intensitygrams (mdi.fd_Ic_flat).
Because the magnetograms and intensitygrams are on different cadences,
to make either 96-minute mask series, an interpolated 96-minute
intensity series (mdi.fd_Ic_interp) was computed.
This is done by
de-rotating bracketing pairs of flattened intensitygrams
and merging them via a weighted average.
This series may be useful for others, so we produced
a summary of the method and usage notes.
Please see here for a collection of movies summarizing these data products:
| Data Product | Description |
|---|---|
mdi.Mtarp |
tracked active regions |
mdi.fd_Marmask |
magnetic activity mask |
mdi.fd_spotmask |
sunspot/facula mask |
mdi.fd_Ic_interp |
interpolated intensitygrams (96m) |
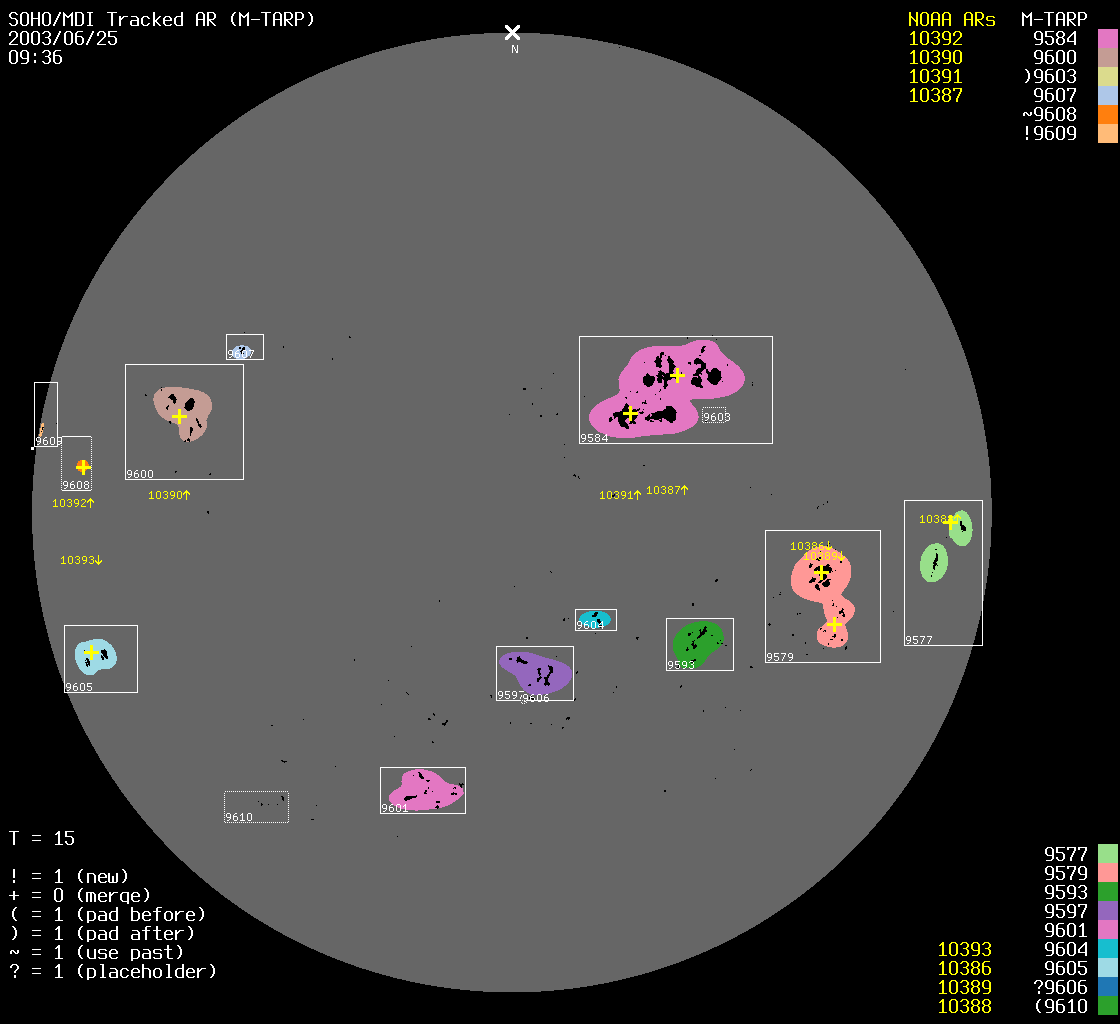
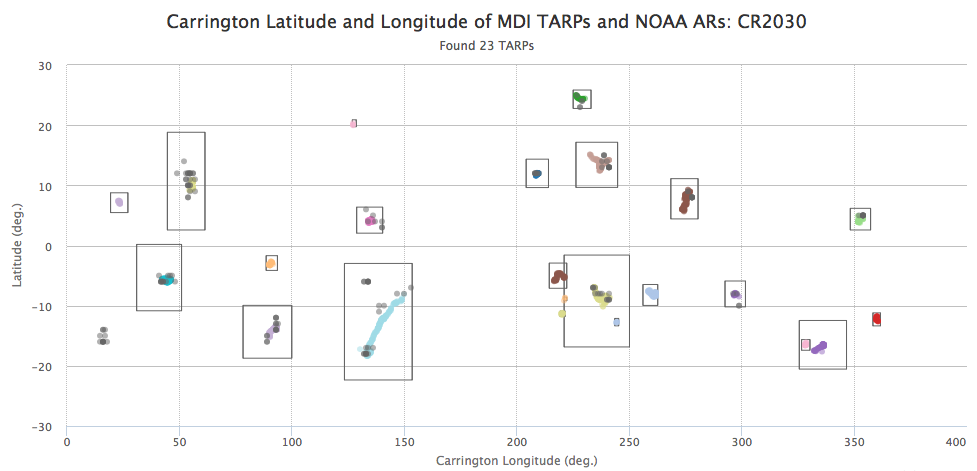
The MDI TARPs have a synoptic map viewer. The viewer allows you to choose a Carrington rotation and see all relevant TARPs and NOAA ARs in a zoomable synoptic map like the one below; see here for more on the map format.
Our poster for the 2013 AGU Fall Meeting explained the MDI TARP data product and gave some pre-release summary information.
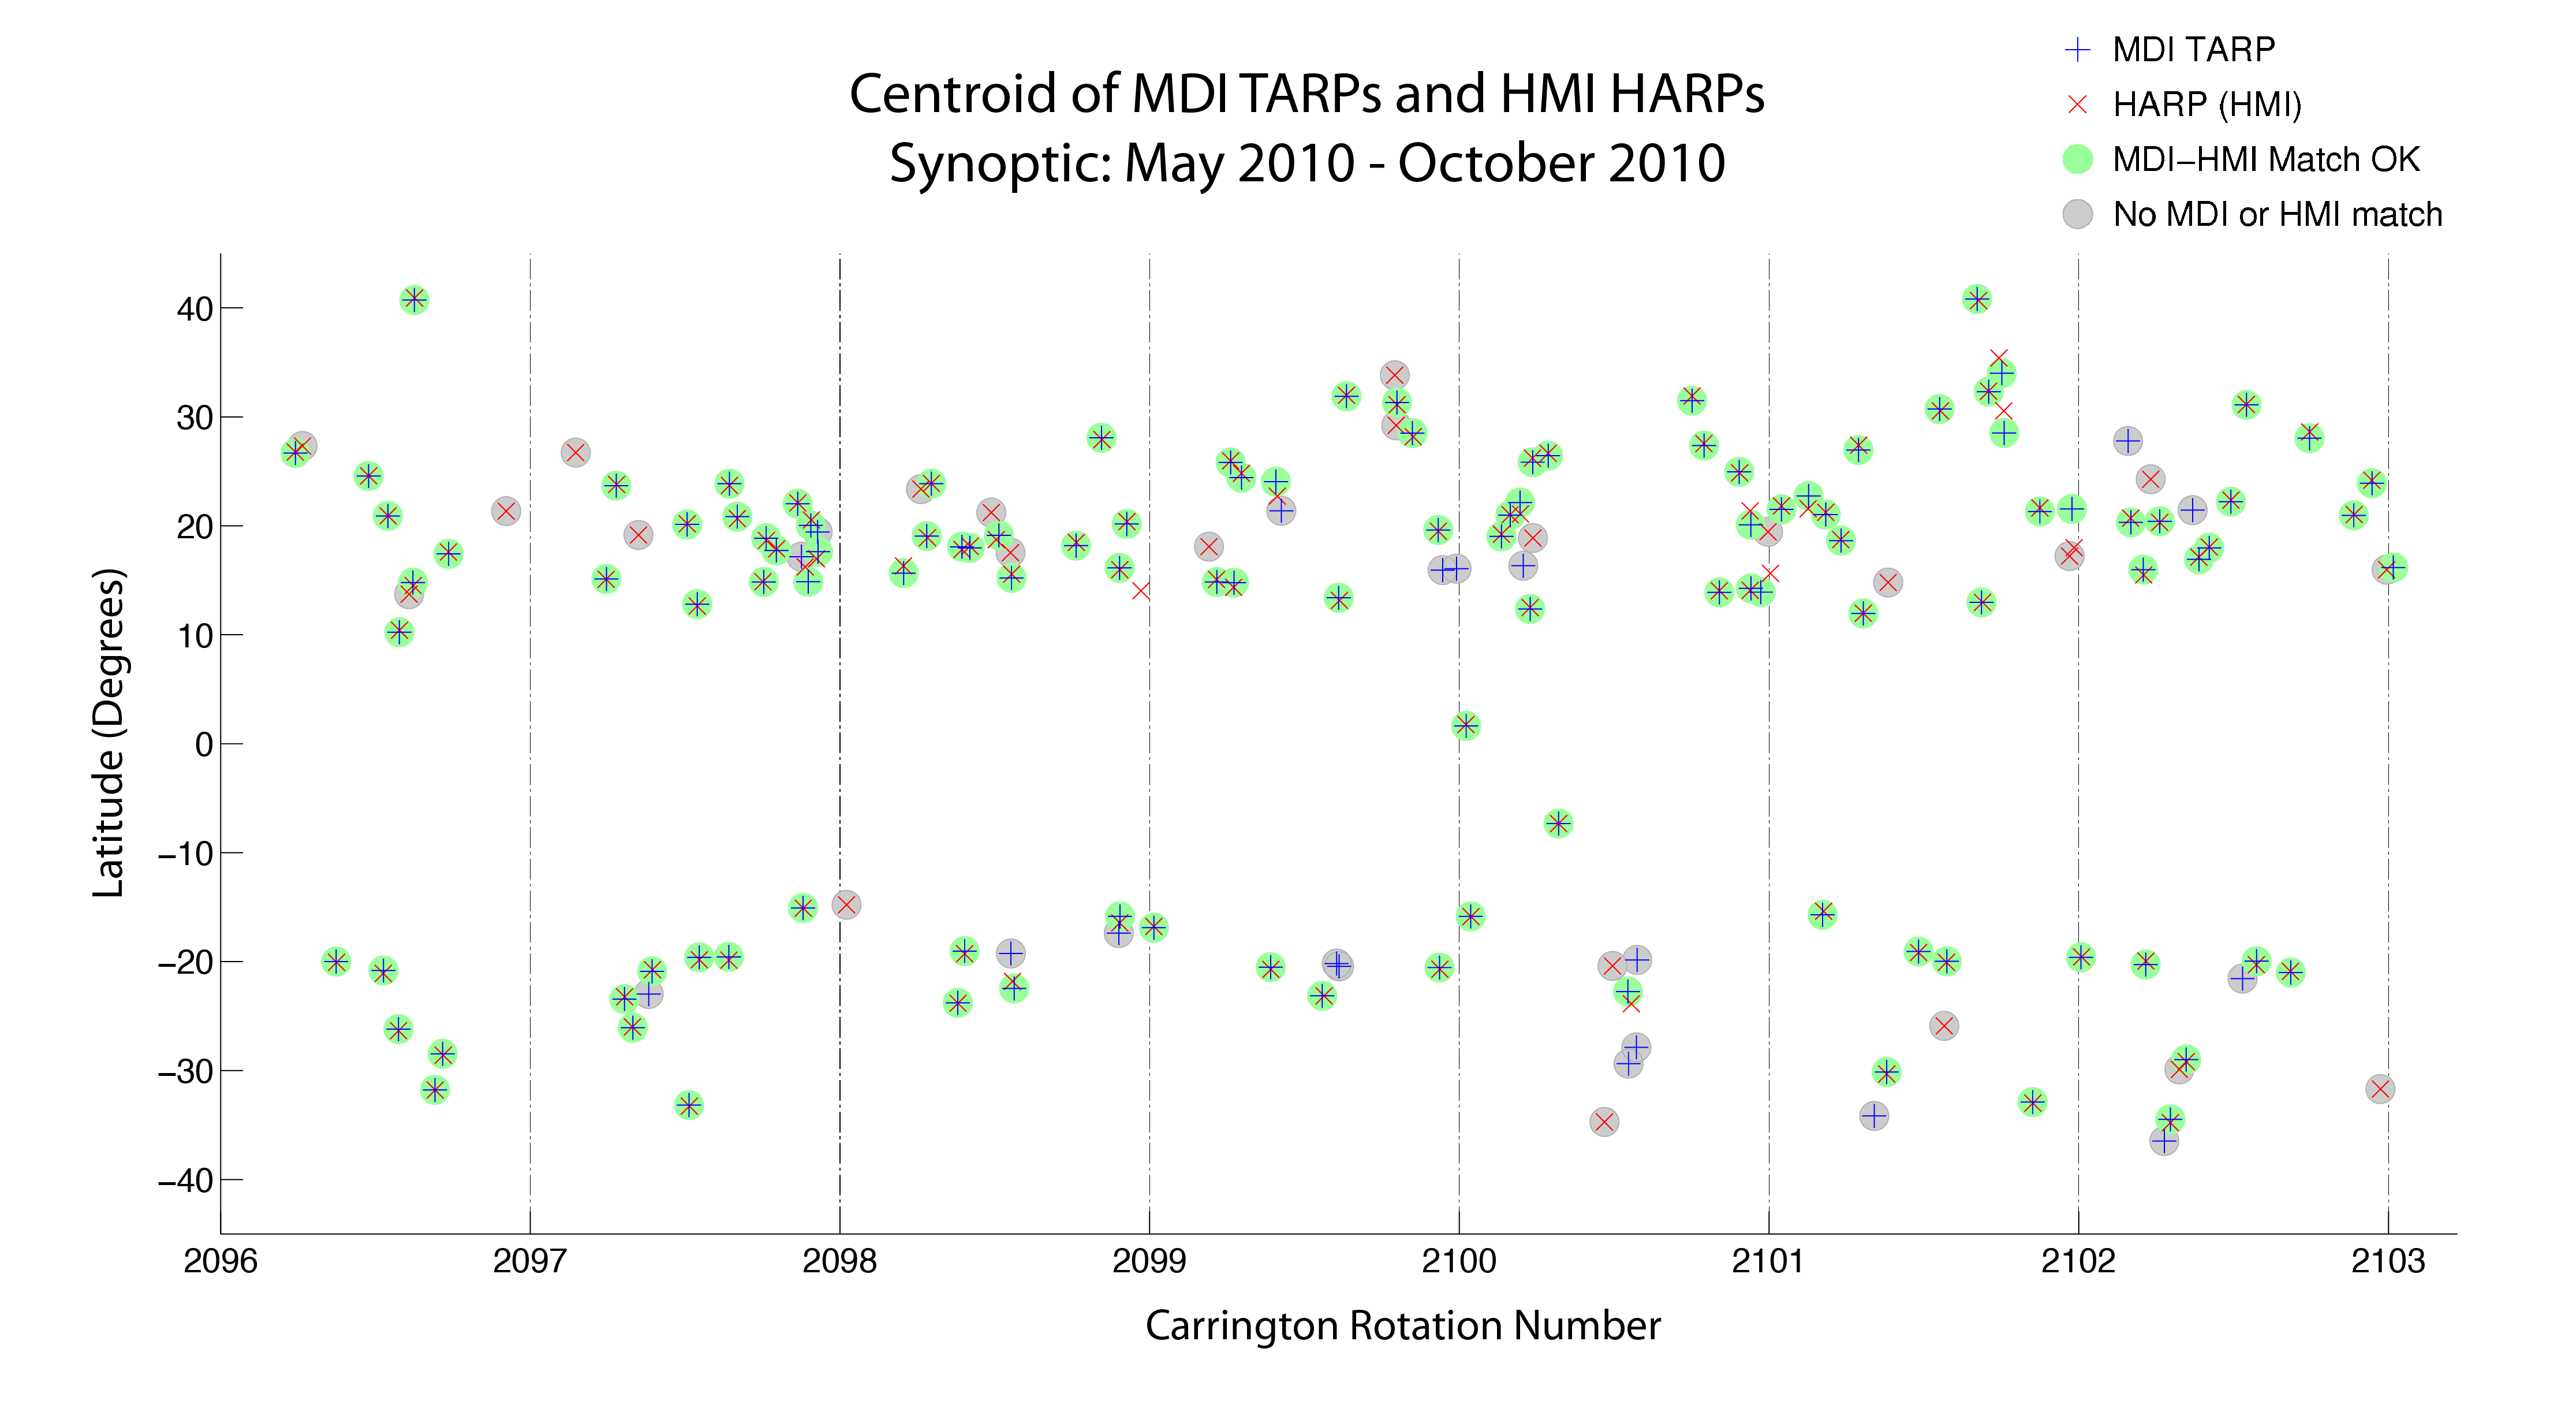
Our later poster for the 2014 SPD meeting contains more results and some comparisons between the HMI HARPs and the MDI TARPs computed during their overlap period in May-October 2010. The following plot shows all the roughly 140 regions in this time interval for both HMI (red X) and MDI (blue +), with a green bubble where the two regions match in location and size. The gray bubbles indicate misses, where either there was a HMI region but no MDI region, or vice-versa. This can arise due to the different temporal and spatial resolutions of the instruments, but also due to differences in association (e.g., a region that is resolved into two pieces in HMI may be seen as one by MDI). There are roughly 120 agreements, and 10 disagreements of each type, over the inter-comparison time interval.
Copyright on these posters is retained by the U.S. government, not the publisher.