The movies linked to below pertain to a tracked MDI
active region data product (M-TARP,
now available as mdi.Mtarp in DRMS).
This 96-minute product is indexed by active region
number, and within that, by time.
Other browse products are linked to here.
The links below point to movies of these four data series:
| Data Product | Description |
|---|---|
mdi.Mtarp |
tracked active regions |
mdi.fd_Marmask |
magnetic activity mask |
mdi.fd_spotmask |
sunspot/facula mask |
mdi.fd_Ic_interp |
interpolated intensitygrams (96m) |
| Year | mdi.Mtarp |
mdi.fd_Marmask |
mdi.fd_spotmask |
mdi.fd_Ic_interp |
|---|---|---|---|---|
| 1996 | Movie | Movie | Movie | Movie |
| 1997 | Movie | Movie | Movie | Movie |
| 1998 | Movie | Movie | Movie | Movie |
| 1999 | Movie | Movie | Movie | Movie |
| 2000 | Movie | Movie | Movie | Movie |
| 2001 | Movie | Movie | Movie | Movie |
| 2002 | Movie | Movie | Movie | Movie |
| 2003 | Movie | Movie | Movie | Movie |
| 2004 | Movie | Movie | Movie | Movie |
| 2005 | Movie | Movie | Movie | Movie |
| 2006 | Movie | Movie | Movie | Movie |
| 2007 | Movie | Movie | Movie | Movie |
| 2008 | Movie | Movie | Movie | Movie |
| 2009 | Movie | Movie | Movie | Movie |
| 2010 | Movie | Movie | Movie | Movie |
The movies range in size from tens of MB to about 250MB, depending on activity level.
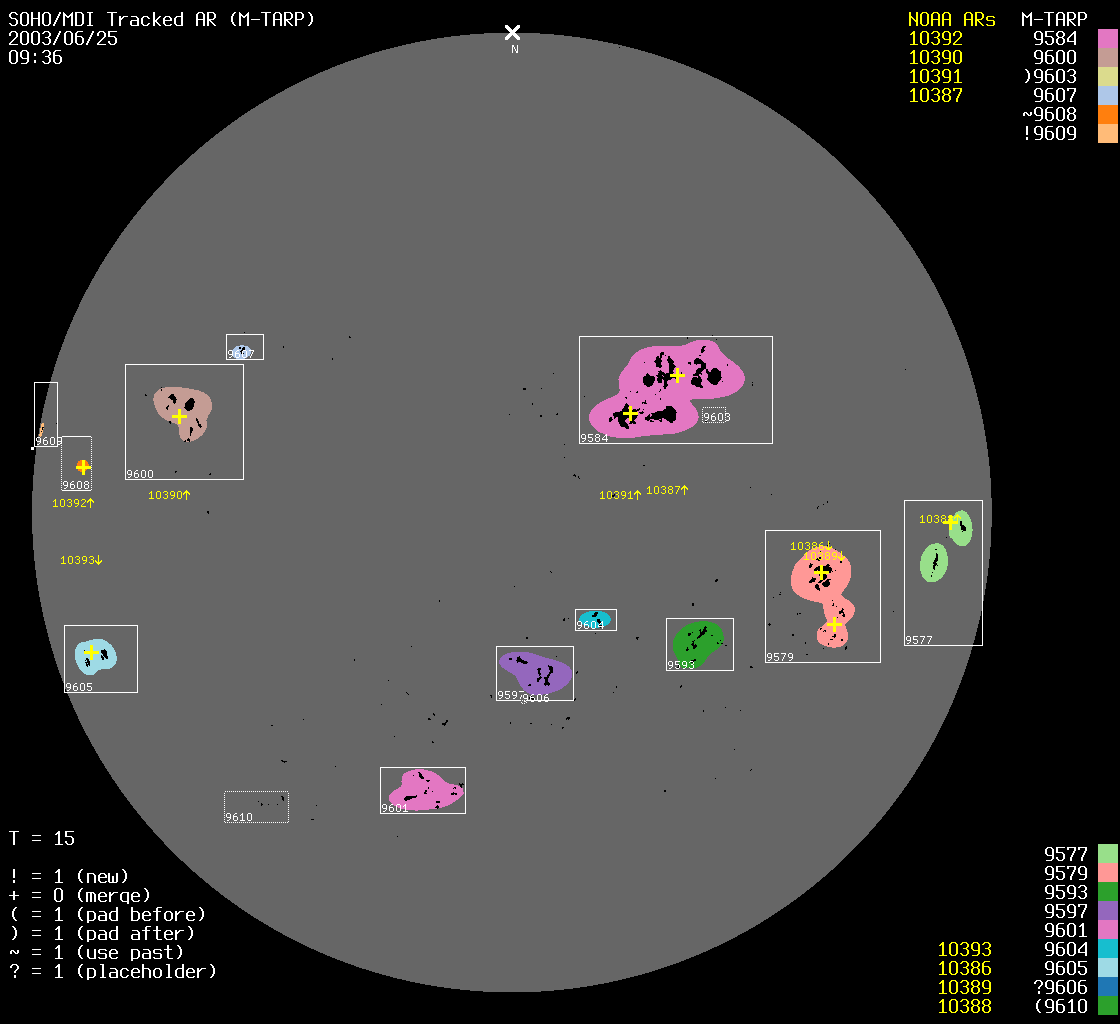
The format of the TARP movies is simple, but some details are not obvious; here is an explanation.
The P-angle of MDI varies, but except for a few hundred images, it is always nearly a multiple of 90°, allowing us to use flips to show the browse images here with solar north on top. This eliminates interpolation. For other angles, we use the flips that bring the apparent P-angle as close to zero as possible, but at the cost of solar north being offset. So for example, when MDI returned to normal operations in February 1999, the P-angle was about -60°, and therefore solar north in the movies here is 30 degrees away from vertical. (Of course, the FITS images are always in the original detector coordinates, with the original P-angle.) Such times are also indicated by showing the numerical P-angle in the display at the top left.
In the interpolated intensitygrams, some missing-data frames
have been filled with disks of all-ones to simplify processing.
This will be apparent because the supergranulation is not seen in these
frames.
To identify this programmatically,
check the QUALITY bits as as described here.
The Q=... line in the interpolated intensitygrams is the
QUALITY of the corresponding magnetogram, not the
intensitygram.